Comment trader des contrats à terme en 3-D :trading de base
Les contrats à terme peuvent être un moyen simple et efficace en termes de capital de spéculer ou de se couvrir. Vous pensez que le prix du maïs augmente ? L'achat d'un contrat à terme sur le maïs /ZC est un moyen plus facile de parier que d'acheter une ferme de maïs et de cultiver la vôtre. Que diriez-vous d'une couverture à court terme sur un gros portefeuille d'actions S&P 500, juste avant une annonce de la Fed ? Les contrats à terme /ES S&P 500 correspondent à ce projet de loi. Tout comme les actions, Les contrats à terme peuvent être des transactions à long terme ou des scalps rapides. Mais contrairement aux actions, Les contrats à terme peuvent également offrir différentes opportunités de trading en raison de leur base, que peu de traders individuels novices connaissent.
Base 101
« Base » est le terme pour la différence des prix à terme dans différentes expirations, ou le prix au comptant (« spot ») du produit sous-jacent et le prix à terme. Les prix à terme dans les différentes échéances sont différents les uns des autres et le prix au comptant en raison du coût de portage, et l'impact de l'offre et de la demande. Cette différence représente la base. /ES à terme, par exemple, avoir des contrats qui expirent en mars, Juin, Septembre, et décembre. /Les contrats à terme sur le maïs ZC ont des contrats qui expirent en mars, Peut, Juillet, Septembre, et décembre. Obligations /ZB, /GC or et, Les contrats à terme sur le pétrole brut /CL ont leur propre ensemble d'expirations.
Base de négociation
En un mot, le trading de base achète un future dans un mois d'expiration, et le vendre dans un mois d'expiration différent, comme vendre le mars /ES et acheter le juin /ES. C'est un peu comme le commerce des paires intermarchés, mais avec une corrélation proche de 100 %. Vous spéculez sur la base qui augmente et s'élargit, ou diminuant et se rétrécissant. Parce que les deux futures sont basés sur le même sous-jacent (par exemple S&P 500, Obligations du Trésor, huile brute, etc.), ils sont fortement corrélés. Ils ont tendance à monter et descendre en même temps. Mais quand ils ne bougent pas en même temps, ou du même montant, la base change.
Parce que la base peut être négative, où le prix du futur à expiration ultérieure est inférieur au prix du futur à expiration plus proche (également connu sous le nom de « déport »), il est important de savoir dans quelle direction vous pensez que l'avenir à court terme peut évoluer, par rapport au futur du mois précédent. Certains futures comme /ES sont régulièrement en déport, donc l'élargissement de la base signifie qu'elle devient plus négative. Si vous pensiez qu'il allait s'élargir, vous pourriez envisager d'acheter le futur à court terme et de raccourcir le futur du mois précédent (par exemple, vous achèteriez mars /ES et court juin /ES).
Lorsque le prix des contrats à terme à expiration supplémentaire est supérieur à celui des contrats à terme à expiration plus proche, cela s'appelle "contango". En contrepartie, la base est positive. Si les futures /CL sont en contango, et vous pensiez que la base allait s'élargir, vous pourriez envisager de court-circuiter le futur /CL à court terme, et en achetant le future/CL du mois précédent.
4 étapes pour obtenir la base
Pour commercer la base, il faut voir la base. Avec ça, penser à nager ® vous a couvert.
1. Dans l'onglet Commerce de thinkorswim ® , vous pouvez voir les expirations des contrats à terme disponibles en tapant le symbole racine (par exemple /ES) et en sélectionnant « Tous » dans le menu déroulant.
2. Pour voir le prix de base entre les expirations consécutives des contrats à terme, cliquez sur le menu déroulant « Diffusion » et sélectionnez « Calendrier ».
3. Cliquez sur la flèche à côté de l'un des contrats à terme pour développer le prix de base, qui est l'expiration ultérieure (ou arrière), moins l'expiration la plus proche.
4. À partir du prix de base que vous venez d'ouvrir, vous pouvez faire un graphique de base en cliquant avec le bouton droit sur le "=" avant le symbole des contrats à terme, et en suivant le chemin de clic « Plus d'infos… »> Graphiques TOS> carré supérieur gauche dans le menu de la grille graphique.

FIGURE 1: Source:thinkorswim by TD Ameritrade. A titre indicatif seulement.
Basis Trading In the Real World
You may consider the futures basis because they can be traded by themselves, kind of like stocks pairs trades. Par exemple, maybe you don’t have a bullish or bearish bias on the futures’ underlying product itself. But considering the futures basis, you think it might move higher or lower.
Trading the futures basis also has potential advantages over stock pairs trading. D'abord, the contract and tick size are the same for a given future. You don't need to adjust the quantities of the trade to account for different contract specification. Seconde, the margin requirement for the basis trades can be lower than for a single long or short future because the basis trade is simultaneously long and short futures. The basis tends to have smaller price changes than the individual future would. So the margin requirement is also smaller.
Let’s look at three futures basis trading scenarios.
Crude Oil (/CL)
Crude oil futures contracts typically go out a couple of years. They’re one of the most liquid, actively traded futures contracts, and the basis can move around a lot. To understand why, think about how crude oil gets turned into gasoline and other “stuff.” It gets pumped out of the ground and transported to a refinery, and that costs money. If the oil is stored, there are insurance and storage fees, as well as interest charges if you’re borrowing money to buy it.
All those things go into the basis of /CL futures, and would make the further-term futures more expensive than near-term futures because those costs are built into the futures’ prices. But with the futures basis, there’s also the expectation of over- or under-supply in the coming months and years. You can see that when you look at /CL futures prices. Backwardation in /CL can happen when the market sees a shortage in crude oil, and where near-term demand outstrips immediate supply. The price of the near expiration /CL future is pushed higher than the back month. But /CL is more often in “contango, ” where the carry costs make the back months slightly higher than the near months, and there is Backwardation in /CL can happen when the market sees a shortage in crude oil, and where near-term demand outstrips immediate supply. The price of the near expiration /CL future is pushed higher than the back month. But /CL is more often in “contango, ” where the carry costs make the back months slightly higher than the near months, and there is equilibrium between supply and demand. If you see /CL in backwardation and you think the causes are temporary, and that /CL will move back to contango, you could consider shorting the near-expiration /CL and buy the further-expiration /CL. The risk, bien sûr, is that /CL could move further in backwardation, resulting in a loss on the trade. And there’s never a guarantee that contango has to happen in the future. But the trade could be profitable if the futures move back to contango before the expiration of the near-term future.
S&P 500 Index (/ES)
One of the most widely watched and actively traded futures is the /ES contract based on the S&P 500 stock index. /ES trades until 3:15 p.m. CT during “regular” market hours. The price of /ES is based on the value of the stocks in the S&P 500 (which is the SPX index), and the cost to carry the portfolio of those stocks. There is an interest charge to borrow money to buy shares. The interest is offset by dividends that are paid by the S&P 500 stocks.
The net impact of interest and dividends determines the basis between the / ES and the SPX. Nowadays with interest rates low relative to dividends, /ES futures are usually in backwardation, and the basis doesn’t fluctuate much. But because S&P 500 stocks stop trading at 3:00 p.m. CT, donc, trop, does the price of the SPX stop updating. And in the 15 minutes between 3:00 p.m. and 3:15 p.m., when the /ES continues to trade, it can move higher or lower than what the basis calculation would suggest based on news that arrives after 3:00 p.m., or on the opening of large positions in /ES in the last 15 minutes of trading that anticipate the next day’s price movement.
If the /ES to SPX basis is $-10, when the /ES moves up relative to where SPX closed and makes the basis $-8, par exemple, that can signal a stronger open the next day. If / ES moves down relative to the SPX closing price to make the basis $-12, that can signal a weaker open the next day. Looking at the /ES to SPX basis before and after 3:00 pm can give you a clue as to the next day’s opening price action. This may impact stop orders, and even technical indicators you might be tracking.
CBOE Volatility Index (/VX)
Volatility futures might be the trickiest to understand. But they might offer the most interesting opportunities. The CBOE Volatility Index (VIX) is derived from the out-of-the-money SPX option prices. When traders anticipate larger price changes in the SPX (i.e. more volatility), the out-of-the-money SPX option prices can increase in price. Cette, in turn, pushes up the VIX. When traders anticipate smaller price changes in the SPX (i.e., lower volatility), the out-of-the-money SPX prices can drop, which in turn drives the VIX lower.
You can’t trade the VIX directly, and /VX futures are a way to speculate on the direction of volatility. But /VX futures are only modestly tied to the VIX. “Modestly” because /VX settles to the VIX settlement value at their expiration. But there isn’t any cost of carry between the VIX and /VX futures be- cause you can’t buy the VIX like you can buy crude oil or a stock portfolio. That makes /VX futures pure indications of how much future volatility the market anticipates. The basis you see between the near and further month in /VX futures reflects whether the market sees more volatility near term or longer term.
Most of the time /VX futures are in contango—where the market expects more volatility the further into the future you look. But when the market panics and drops, generally the VIX rallies the most, the closest expiration /VX future rallies a bit less, and further expiration /VX futures rally a little less than those. That can push /VX futures into backwardation, and make the basis negative.
Figure 2 charts just this scenario, when a market dropped and pushed volatility higher, and the /VX basis became negative.
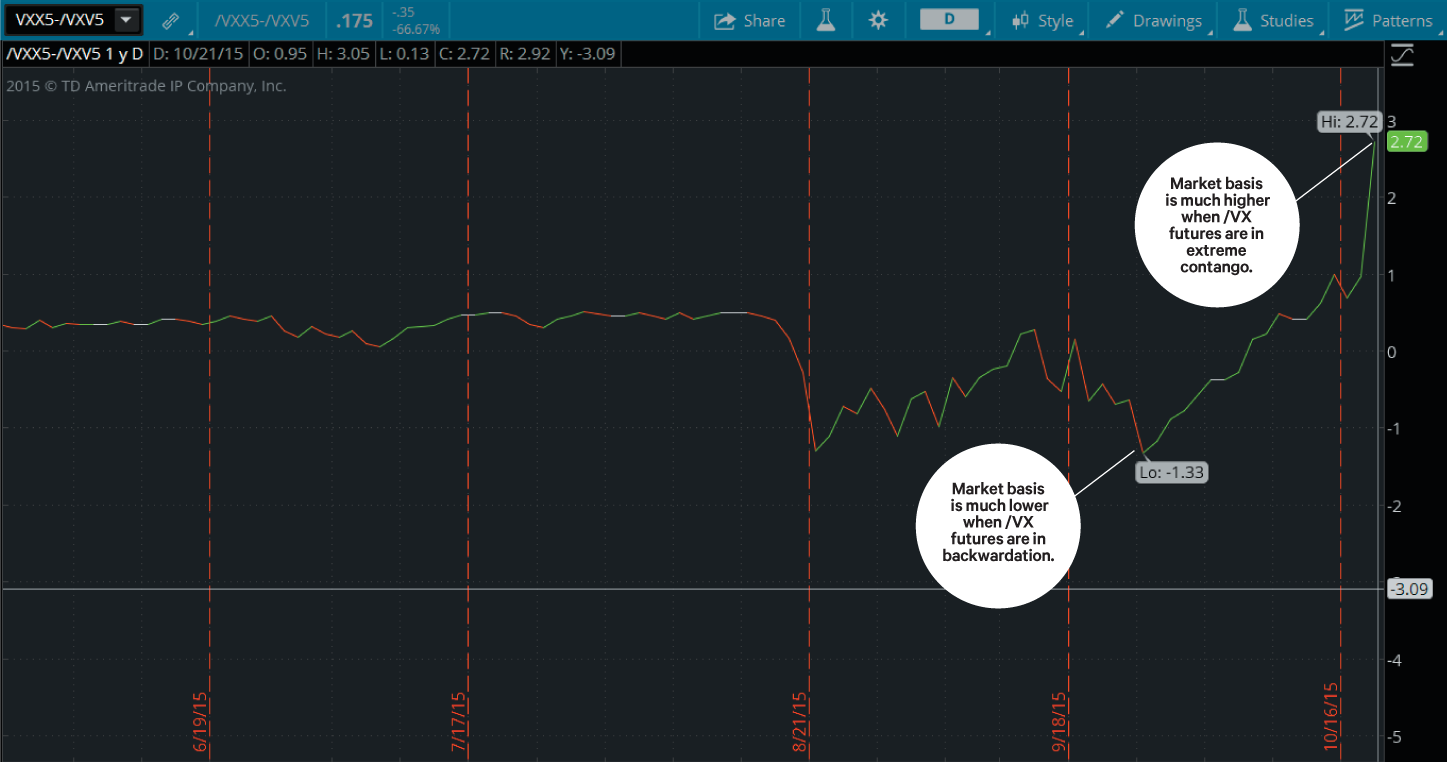
FIGURE 2:NEGATIVE BASIS
To view basis on /VX, you have to enter it manually as a pair (i.e., longer-term future minus shorter-term future, or /VXX5-/VXV5 as shown above). Most of the time, /VX futures are in contango, as was the case prior to August in the chart. Source:thinkorswim by TD Ameritrade. A titre indicatif seulement.
Most of the time, the price of the back-month /VX future is higher than the price of the near-month /VX future, and the basis is positive. When the market became more volatile, the basis became negative. If you believe the market will calm down, and the front-month /VX will drop relative to the back month, and the basis will go from negative to positive, you could consider shorting the front-month /VX future and buy the backmonth /VX future. That trade could be profitable if the basis goes from negative to positive. But the trade would lose money if the basis became more negative—which is something that happened in the 2008 market crisis.
At the closing bell, /VX basis trading isn’t for the faint of heart. If you’re already a proficient futures trader, consider this another tool in the strategy toolbox. But even if you’re not ready to trade it, /VX basis can certainly offer you clues as to how the market is forecasting volatility.
Open a Futures Account
For qualified accounts, you’ll need Level 3 options approval to trade futures. Log in to your account at tdameritrade.com. Under the Trade tab, go to Futures &Forex for more information.
-
Comment trader les métaux
Le commerce est une méthode qui est canalisée par un système aidant les articles ou produits nécessaires à atteindre les personnes requises. Le commerce des métaux est lune de ces pratiques qui crée u
-
Comment négocier des contrats à terme
Quest-ce quun contrat à terme ? Un contrat à terme (court :contrats à terme) est un accord légal pour acheter ou vendre un actif, une marchandise ou un titre particulier à un prix prédéterminé à un m
Négoce à terme
- Base étroite
- Êtes-vous prêt à négocier des contrats à terme ?
- Comment fonctionnent les contrats à terme S&P 500 ?
- Une introduction au trading de contrats à terme sur l'argent
- Comment négocier des contrats à terme sur indice Dow Jones
- Commerce du papier
- Comment négocier le pétrole brut
- Comment commencer à négocier sur les marchés des produits agricoles
- Comment négocier des contrats à terme sur matières premières à l'aide d'un logiciel
-
 Comment trader les actions
 Le trading dactions peut sembler glamour, mais dans les coulisses, cest en fait beaucoup de travail acharné et peut impliquer des recherches approfondies. Même si ce nest pas toujours facile, les nouv...
-
 Comment commencer à négocier des contrats à terme
 Par :Wayne Duggan Pour les nouveaux commerçants, les contrats à terme peuvent sembler être un marché compliqué réservé uniquement aux traders expérimentés. Mais les contrats à terme sont comme ni...